

February 9, 2017
Will Enthusiasm Yield Fruitful Gains?
Note to readers: Our current practice is to post this most current letter to the website under password protection. Older letters will be available to the public. So should you find it easier to visit the website, please do so; the password is currently, “xxxxxxx” … please feel free to share with anyone you feel might have an interest.
The theme of our January letter was to note that the trends we’d been speaking to since last August accelerated post the November election. All major asset classes revalued to a lower risk profile in nearly textbook fashion while sentiment readings jumped with a measure of enthusiasm that led one veteran market analyst to recently observe that the shift in sentiment was one of the biggest, and we add quickest, he’d seen in his investment career (more on sentiment later).
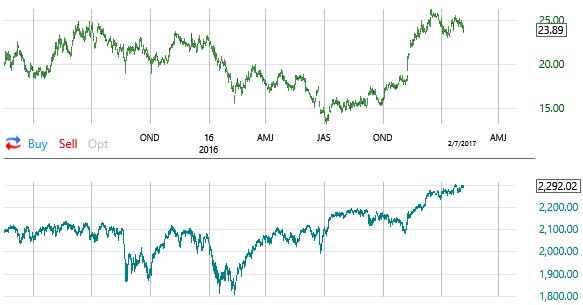
Perhaps there is no more visible evidence of the changing investment landscape than investor reaction to the Federal Reserve (Fed) rate hikes in December 2015 and December 2016. In late 2015, the market was stilled mired in slow growth expectations with interest rates low and dormant. So when the Fed tried to get out in front of the market by raising rates prematurely, the response was predictable; as the following chart shows, stocks sold off, and, quite contrary to Fed predictions, interest rates dropped as well. The chart also reveals that by the time the Fed raised rates in December 2016, the market had already raised them, so the Fed was now less dangerously following the market’s lead. We chronicled the changing relationship during the third quarter of 2016, going so far as to comment last September that “We also observe that the bull market in bonds is some 35 years old, and we’ve recently finished what might prove to be an important reversal. The time to be loading up on yield assets might have passed.” Then in November we wrote “Given the rapid rise in yields post election, perhaps we will look back someday and conclude that the rate lows of July 2016 marked the nadir of the 36+ year bull market in bonds (note higher bull-market bond prices equal lower interest rates).”
Top Pane – Ten Year Government Yield (note 23.89 = 2.389%)
Bottom Pane – S&P 500 Index
Chart(s) courtesy of TC2000.com
We also noted in January that a couple of missing bull-market pieces had fallen in place; particularly the Dow Transportation average finally moving to a new high to confirm the new high the Dow Industrials made last November. This confirmation, one asset complex directionally confirming another, comes from the age-old Dow Theory. For a brief introduction to the Dow Theory, visit Wikipedia.org. Though we welcome the bull-market confirmation, we noted in January that “… historically, the point of confirmation by the Dow Theory has not been an optimal time to make major stock commitments.” We also observed that while “we don’t ‘sense’ a bull-market ending scenario … we suspect that with the other short-term concerns we’ve listed that a pullback of some meaningful degree wouldn’t be a surprise.” Well, we’ve not experienced a pullback in the averages; we’ve seen a rotational, sideways correction punctuated by earnings-related pops and drops.
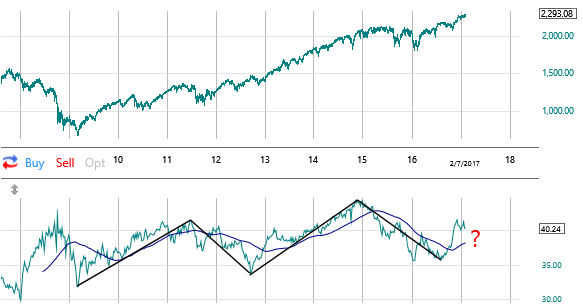
The bottom pane of the following chart, first used last November, shows the Dow Transportation average’s surging relative strength (RS) into mid-December at the point of its bull-market confirming new high. We here again want to highlight the importance of the RS of the Dow Transportation index, particularly its directional strength. As can be seen, stocks (S&P upper pane) generally, not always, do better when the Transportation sector is out taking the lead. But we also note that (see question mark) though the index began to really improve in the 3rd quarter of last year, it has stalled out and is quite a distance away (above in this case) from its moving average seen (smoothed blue/purple line). This suggests it is vulnerable to further stalling in the near term.
Top Pane – S&P 500 Index
Bottom Pane – Dow Transportation Relative Strength
Chart(s) courtesy of TC2000.com
OK, so the emerging trends in 2016 were brought to a definitive conclusion post-election, including a reengagement of the bull market. So what now? Well, we continue to believe in the bull-market case, but we also note that we’ve not yet seen evidence that the rotational sideways correction that generally began in mid-December has run its course. Interest rate complexes (VWOB, LQD, HYG, JNK and US government 30, 10 and 5-year rates) are net nowhere since mid-December. Gold has rallied (we mentioned last month that contrarians might take notice), but oil is essentially flat. Small caps and transportation stocks are below their December peaks; the Dow Utility average has nearly flatlined, and while the Dow Industrials and S&P 500 are slightly above, the Nasdaq, buoyed in part by the FANG stocks, has established a string of new highs. Quite frankly, we’d like to be seeing the opposite; we’d prefer an improving transportation and small-cap sector’s and some broadening of support beyond a few big Nasdaq leaders. At the time that we’re concluding this issue, we note the intraday action on Feb 9 is generally what we’ll want to see; transports and small caps are rallying more than twice that of the Dow Industrials, S&P 500 and Nasdaq Composite.
So, really not much has changed since last month. Thus far, it appears that we’re experiencing more of a ‘time correction’ than a ‘point correction.’ The former can frustrate many as the market bides its time moving sideways while different sectors go about rotational corrections. It is as if the horses are jockeying to the gate, but the next leg of the market race has yet to start. Perhaps this is one of those times that you have to be careful about over thinking things and be more resistant to “market noise.” We are in a confirmed bull market with improving underlying economic fundamentals as evidenced by the two Fed economic models as seen here and here and, as we mentioned last month, interest rates are for now in a sweet spot, “not too high to trigger the negatives such as detrimental inflation nor too low as to suggest an economic collapse into dangerous deflation.”
We’ve recently commented, actually who hasn’t, that the facts of economic growth will now have to confirm the renewed higher expectations. And there is truth to that, for sure. And perhaps the nearly two month sideways market action is just part of the process of the professionals vetting the most likely outcome. In our own little predictive way, we note that a Federal Reserve Bank of San Francisco publication (Measuring News Sentiment; working paper 2017-01; January 2017) concludes, “… sentiment extracted from newspaper articles correlates with both contemporaneous and future key business cycle indicators … perform(ing) better than both the University of Michigan and Conference board measures of consumer sentiment.” So as we take note of the extreme shift toward positive sentiment that we mentioned earlier, we are bolstered by this research evidence suggesting it has valid predictive capabilities.
But, to the point, factual evidence of improvement is going to have to materialize. We can ride improving consumer-sentiment (see here), indications of a boost in business capital-spending plans (see here) and the improving Federal Reserve quantitative economic models mentioned above only so far.
So while we await economic data, what market-based indicators might we be monitoring? We’d submit that the markets move ahead of developing good and bad news, so it is a worthy endeavor. We’ve already mentioned the importance of the RS of the Dow Transportation sector. We’ve also postulated that the Guggenheim Shipping ETF (SEA) would be important; we will watch to see if its current correction is contained. We’ve also mentioned in recent months the importance of the small-cap sector as measured by the Russell 2000 Index or the iShares Russell 200 Index ETF (IWM). Here again, we are seeing a corrective phase that we’d like to see contained.
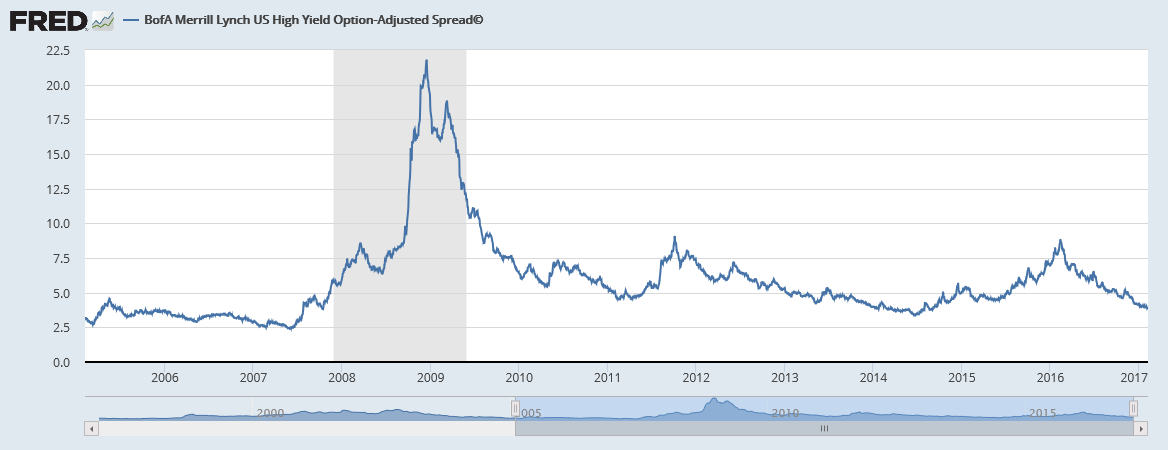
We’d also add the high-yield (HY) sector that we’ve frequently addressed. Perhaps the biggest risk to stocks is rising rates (30- and 10-year US government rates above 2.19% and 2.62%, respectively) backdropped against continued sluggish economic activity. Such a scenario would put a particularly hard squeeze on companies that have leveraged their balance sheets (added debt) so as to be faced with ever increasing costs as they face refinancing the debt at higher rates. One way of monitoring the HY-sector is via the St. Louis Federal Reserve’s FRED Economic database. The following chart is a Bank of America Merrill Lynch product that essentially compares the difference (spread) between high-yield debt (that issued by companies considered less than ‘investment grade’) with the debt issued by companies with stronger balance sheets. The larger the spread, the higher the perceived market risk. As can be seen, the HY-spread has narrowed, read lowered risk metrics, since early 2016. Not all periods of rising spreads lead to full-fledged bear markets, but we note that the rising spread environment beginning in 2007 that presaged the housing bubble collapse along with the rising environments in 2011 and late 2014-2015 were two periods that were problematic for stocks.
BofA Merrill Lynch US High Yield Option-Adjusted Spread©
retrieved from FRED, Federal Reserve Bank of St. Louis, February 7, 2017
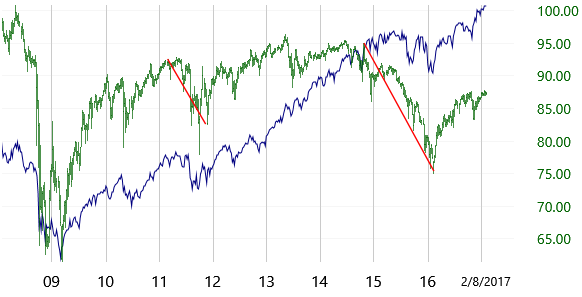
Another way to monitor the health of the high-yield sector is to keep an eye on the iShares iBoxx $ High Yield Corp Bond ETF (HYG). It is important to note that the HYG is a price index; because yields move inversely, when price is moving down, yields are rising. So note in the chart the two periods of rising HY interest rates in 2011 and all of 2015. Both periods were problematic for stocks as depicted by the S&P 500 (blue line). Indeed, many of the S&P 500’s corrections were accompanied by rising rates. While the HYG had a good rally in 2016 (lower rates/lower perceived risk), it has made no net progress since late October, thus not providing a measure of confirmation to surging stock prices. We’d expect that IF broader measures of economic activity ‘in fact’ improve, the HY complex will show marked improvement as depicted by higher prices and lower yields. So IF you were to see the HYG roll over from current levels, you might well consider a bit more defensive market position.
iShares iBoxx $ High Yield Corp Bond ETF (HYG) (green)
S&P 500 (blue)
Chart(s) courtesy of TC2000.com
In summary, IF you see Transportation and small caps acting poorly at the same time that rates are rising with high-yields particularly weak (declining HYG prices and widening HY spread), take some defensive action. Please note this is not a prediction, it is solely an attempt to shed light on circumstances that should they arise you would not be taken by surprise and frozen into inaction.
At this time, as we mentioned earlier, we are in a confirmed bull market. Last year was a transitional year, and we don’t often see back-to-back transitional years; and what we transitioned to was a confirmed bull market scenario. We’ve noted, however, that the moment of confirmation isn’t a time to make large new commitments. Thus far, stocks, at least as measured by the leading averages, have not pulled back; they’ve mostly drifted with pockets of earnings-related strength. And while the correction since December is aging, it hasn’t reconciled itself yet. So be patient, make whatever asset allocation decisions you might need to make based on recent market activity (We’ve mentioned scaling back on ‘yield trade’ exposure and letting cash build) and try to ignore the ‘noise’ in coming weeks.
Disclosure and Trading Policy
It should not be assumed that current recommendations will equal past performance or be profitable. The information presented has been obtained from sources believed to be reliable, but accuracy cannot be guaranteed. All material is subject to change without notice. Opinions offered are not personalized recommendations to buy, sell or hold securities. Officers, employees and affiliates of Roeing Research and Trading LLC may transact in Purchase and/or Sale Recommendations of the InternalTrends Blog or eNewsletter but not before the fourth day after the recommendation has been posted on the website; an exception being made for limit and/or stop orders that are not triggered at the time of dissemination. Securities mentioned in other parts of the eNewsletter or Blog may be bought or sold at any time.
Recent Comments