
January 3, 2017
Has Risk Really Declined?
Note to readers: Our current practice is to post this most current letter to the website under password protection. Older letters will be available to the public. So should you find it easier to visit the website, please do so; the password is currently, “xxxxxxx” … please feel free to share with anyone you feel might have an interest.
2016 was a transitional year. As we came to press in August, we postulated the possibility that we were morphing from a period where rising interest rates were ‘feared’ and bad for stocks due to the perceived fragility of the economy to a framework where higher interest rates based upon renewed optimism of improving underlying fundamentals would be welcomed. We leaned heavily on the extremely bearish sentiment as a basis for optimism. We warned of the risk to two trends that were maturing under the former rate structure: 1. too many people had squeezed into ‘bond-proxy’ or ‘yield-seeking’ stocks and 2. too many had become overly reliant on the FANG stocks (Facebook, Amazon, Netflex and Google/Alphabet). We dated the top of the ‘bond-proxy’ trade to June 27, the peak in the relative performance of the Dow Utility Average. The FANG stocks became exposed following the election as all four now trade below their October peaks while stocks generally have gone on a strong post-election run. We began to watch for newly emerging trends, specifically strength in more ‘growth’ oriented stocks and rising interest rates. We noted a few missing puzzle pieces, in particular the lagging transportation and small-cap sectors. The market’s post-election rally eliminated these missing pieces as the transportation and small-cap sectors rallied to new all-time highs, thus eliminating important non-confirmations.
One of the overlooked aspects of the “Trump Rally” is that the extreme pessimism that we’d regularly highlighted created a launching pad off which stocks were able to rally farther than they otherwise would have. Portfolios, positioned in accordance with overly negative perspectives, needed substantive, and quick, adjustments; the rally was no doubt enhanced by another aspect of pessimism, good old-fashion short covering.
But now what? All asset classes appear to have adjusted in line with text-book metrics of improving consumer and investor sentiment and a concomitant reduction in perceived risk. Stocks have rallied generally, the transportation and small-cap sectors, in particular; bonds have sold off with higher interest rates; industrial metals have done well, but gold, a fear and inflation gauge, has noticeably weakened.
At this juncture, we rest thankful that our bullish positioning in 2016 has been rewarded and confirmed. That having been said, investors/analysts are decidedly less bearish/concerned than they were in most of 2016 and, historically, the point of confirmation by the Dow Theory has not been an optimal time to make major stock commitments. The Dow Transportation index closed at a new high on December 7. It then closed at a high of 9421.08 on December 8. It is now 15 days into a correction. When we penned our last letter in mid-November, we leaned on watching for relative strength in the transportation index. Admittedly, we’d expected (hoped really) to see relative strength during a correction, though what we saw was incredible strength during a fascinating rally.
We retain a “sense” that the FANG stocks remain dangerously ‘over owned’ … So many analysts were chasing these stocks – we recall being alarmed by an article a couple months ago about a renowned value fund manager whose largest position was Amazon – and they’ve not yet been hurt for doing so. We note a recent brokerage report that quantified Amazon as being the most ‘over owned’ stock in the marketplace. Our gut tells us that this trade needs to be unwound and that it will most likely happen during a general market correction.
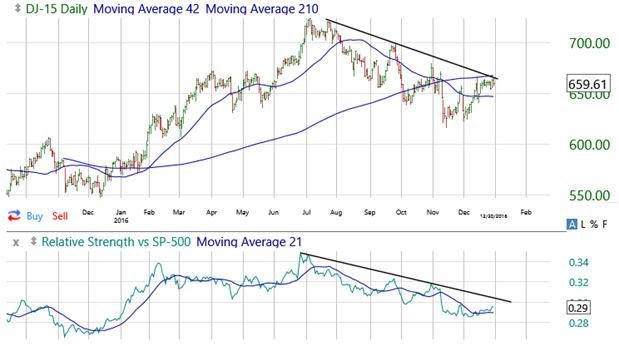
Utility stocks have rallied and are now butting up against meaningful resistance. Last month we wrote, “… scaling back exposure to … bond proxies … (is) a long-term proposition, but we’d now scale back on rallies…” Well, we’ve rallied. As can be seen in the following chart, the Dow Utility Index has come off its November/December lows. Outwardly, in the top pane you can see how its come into 210-day moving average and trendline resistance. Internally, and more importantly from a longer-term perspective, its line of relative strength has not rebounded as much and remains in a well-entrenched downtrend.
Dow Utility Index – bottom pane Relative Strength
Chart(s) courtesy of TC2000.com
The overriding metric to be aware of is that perceived risk has been reduced. There is clearly a renewed optimism that can be seen across a number of frameworks, from analysts’ brave new bullish calls to a surge in consumer confidence. The University of Michigan reported on December 23rd that its consumer sentiment reading reached 98.2, the highest level since January 2004. Click here for some historical perspective. But what, as good contrarians, are we to make of the renewed optimism? At this juncture, we suspect that with the other short-term concerns we’ve listed that a pullback of some meaningful degree wouldn’t be a surprise, but we don’t ‘sense’ a bull-market ending scenario.
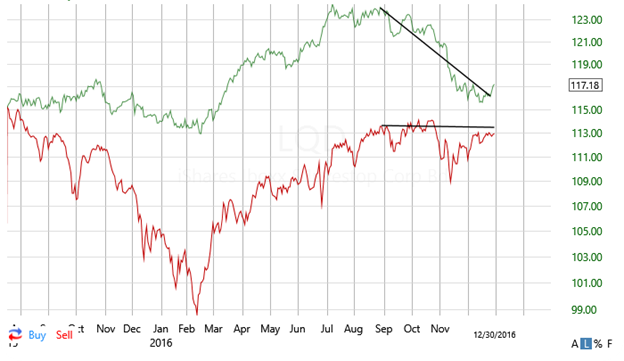
Another indication of risk reduction is the divergent performance of the high-yield bond sector as measured by (HYG) and (JNG) versus investment grade corporate debt (LQD) and foreign sovereign debt (VWOB). The fact that yields have risen on (LQD) and (VWOB) since Q3 of last year relative to the high yield sector means that investors are not requiring nearly as high a compensation premium for default risk, i.e., perceived risk reduction. This basic relationship should continue. As can be seen in the following chart, Investment grade yields have risen since the third quarter of last year (note that these are price indexes so yields move inversely; lower prices equal higher yields). But high yield debt has remained stable. So the spread, or premium, required of high-yield debt has been reduced, an indication of less perceived risk.
Debt Structure
Investment Grade Corporate (green) vs High-Yield (red)
Chart(s) courtesy of TC2000.com
We also note the symmetry with long-term inflation expectations subdued, as reported by the University of Michigan survey (see here), and gold being one of the worst performing metals in 2016. Outflows from Gold funds are running high, and leading financial publications have written of gold’s demise. These funds flows provide further evidence in the risk-reduction metric. We’d also note that good contrarians might take notice!
The strong dollar and rising interest rates have been the “yin” to the gold market’s “yang.” So to get a boost to gold we’d likely need to see some reversal in those trends. We don’t have a ‘feel’ for the dollar at this juncture, but we do suspect interest rates will pull back a bit from strong post-election rallies. We stated last month, “Given the rapid rise in yields post-election, perhaps we will look back someday and conclude that the rate lows of July 2016 marked the nadir of the 36+ year bull market in bonds (note higher bull-market bond prices equal lower interest rates).” We noted, however, that the rapid nature of the rise was likely unsustainable; to be sure, they continued rallying into mid-December but have since pulled back a bit. At this juncture it is important to note that interest rates remain within a 36+ year long bull market (lower yields = high bond prices). The following chart shows that though rates have rallied sharply, they’ve yet to show even the smallest reversal of trend dating back to the late 1970s! It is important to note that the post-election rise is welcomed not feared. The bullish case for stocks needs this relationship to continue. We are in a sweet spot for interest rates right now; not too high to trigger the negatives such as detrimental inflation nor to low as to suggest an economic collapse into dangerous deflation. Last August, we wrote, “rising interest rates from economic strength should be welcomed.” What we have is, rising interest rates from rising expectations are being welcomed.
30-Year U.S. Government Bond Yield
Chart(s) courtesy of TC2000.com

The theme since launching in August has been to retain a bullish investment posture while watching out for a changing underlying market dynamic. We noted that old trends appeared dangerously crowded (bond proxy stocks, those stocks being bought simply because of their attractive yields, and FANG stocks, the small cadre of tech stocks that had been doing well and thus boosting many managers’ performances). And we were watching for newly emerging trends, spearheaded by ‘growth stocks’ and those benefitting from rising interest rates along with improving underlying economic fundamentals. The Trump election gave a boost to these new trends, and we do credit a good measure of the markets advance since the election to a resulting rise in expectations, but we also note that the pre-existing bearishness provided an accelerant to the rally as managers/investors scampered to realign portfolios.
But as we asked earlier, now what? The cycle of adjustment is somewhat advanced. We noted how all asset classes appear to have adjusted in line with text book metrics of improving consumer and investor sentiment and the concomitant reduction in perceived risk. So have we just launched into a new multi-year bull market, or have we just witnessed the cherry on top of an aged bull market? We clearly don’t have the answer to that question but we note there are strong arguments in both camps. What we believe at this juncture is that there is ample evidence as laid out in this letter to be decidedly more cautious as the new year emerges. Now we’re assuming one has a fully-invested, allocation-appropriate portfolio. We’d not be chasing strength; we’d be scaling back on any overweighting in ‘bond proxy’ stocks and we’d now add some of the extended emergent sectors such as financials (Goldman Sachs comes to mind) and letting cash build; we’d be locking in some of the improved yields seen in government and corporate bonds, and we’d refresh shopping lists and determine where excessive cash build can be deployed as opportunities arise.
We postulated last month that “… this move up in interest rates and concomitant rally in stocks is based on renewed optimism for a stronger economy. It will now have to materialize.” We’d like to see firm though controlled energy pricing and interest rates, particularly stable high-yield rates. Moves in the near term by the 30-year U.S. government yield above 3.25% (currently 3.06%) and the ten-year yield above 3.04% (currently 2.45%) would be problematic. We’d like to see relative strength in the Transportation and small-cap sectors, particularly during pullbacks. And we’d like to see high-yield debt remain stable.
We are going to watch the Guggenheim Shipping ETF (SEA) as a proxy for international trade; more on this in coming months; it is basically a sector with abhorrent fundamentals that are getting ironed out. And we just don’t see the U.S. economy burgeoning in isolation. The low of last January, 9.68, and June and November’s matching lows of 10.34 are important benchmarks. The idea here is that IF the fundamentals are improving in the U.S. and around the world, these price levels should hold.
Another proxy stock to watch is Oaktree Capital Group (OAK: $37.50) they prosper on others pain; they’ve raised a lot of money to invest in distressed opportunities, as such should provide a wonderful long-term hedge. The idea here is that the stock will be rallying before problems are generally evident to the masses.
For economic fundamentals, keep an eye on the two Fed economic models, particularly around important release dates as follows:
| Release | Date of release |
| ISM Manufacturing Index, Construction spending | 1/3/2017 |
| International trade, Employment situation, M3 Manufacturing | 1/6/2017 |
| Wholesale trade | 1/10/2017 |
| Retail sales + inventories | 1/13/2017 |
| Housing starts | 1/19/2017 |
| Personal income and outlays | 1/30/2017 |
Bottom line: The InternalTrends emerging in 2016 are now decidedly more visible. The bullish case for stocks is confirmed, but confirmation points are not historically times to make substantive commitments. So we would not raise cash arbitrarily, but to the extent that extended positions are trimmed, we’d let cash build for now. Pessimism has clearly been reduced and optimism is on the rise.
Disclosure and Trading Policy
It should not be assumed that current recommendations will equal past performance or be profitable. The information presented has been obtained from sources believed to be reliable, but accuracy cannot be guaranteed. All material is subject to change without notice. Opinions offered are not personalized recommendations to buy, sell or hold securities. Officers, employees and affiliates of Roeing Research and Trading LLC may transact in Purchase and/or Sale Recommendations of the InternalTrends Blog or eNewsletter but not before the fourth day after the recommendation has been posted on the website; an exception being made for limit and/or stop orders that are not triggered at the time of dissemination. Securities mentioned in other parts of the eNewsletter or Blog may be bought or sold at any time.